Sorting is at the top of the list for algorithm design and evaluation. I recently started refreshing my memory on algorithm design. I realized (again) that I am more interested in them than just the Big O notion. For example, the Insertion sort is particularly interesting because at each point in time the algorithm has two piles: a sorted list and an unsorted one; the algorithm picks one item at a time from the unsorted list and puts it where it belongs in the sorted list. The powerful thing about it is that adding new elements to the unsorted pile does not interrupt the sort process.
I decided to write some code to show the beauty of these algorithms with colourful graphs. I did that in two parts:
1. A code that gets a random list of elements (or a list sorted decrementally) and sorts it (incrementally) and records the position of elements as it does so.
2. A code that reads the element position records from the beginning till they were sorted and draws them as a graph.
For part 1 I wrote a class in Python which I called ListPlus; it is a list that distinguishes the elements from each other (even if they are equal) and records their position at all times. The result of each sort is a csv file which is the input to the next part.
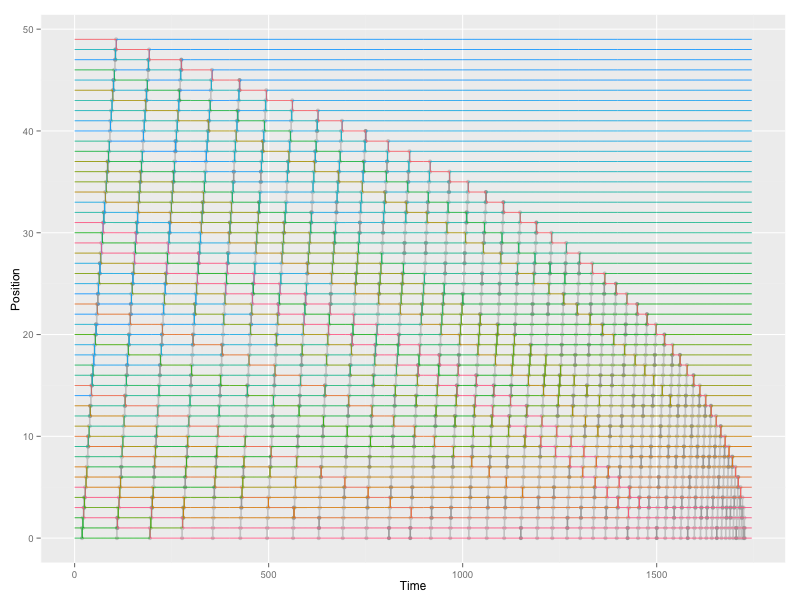
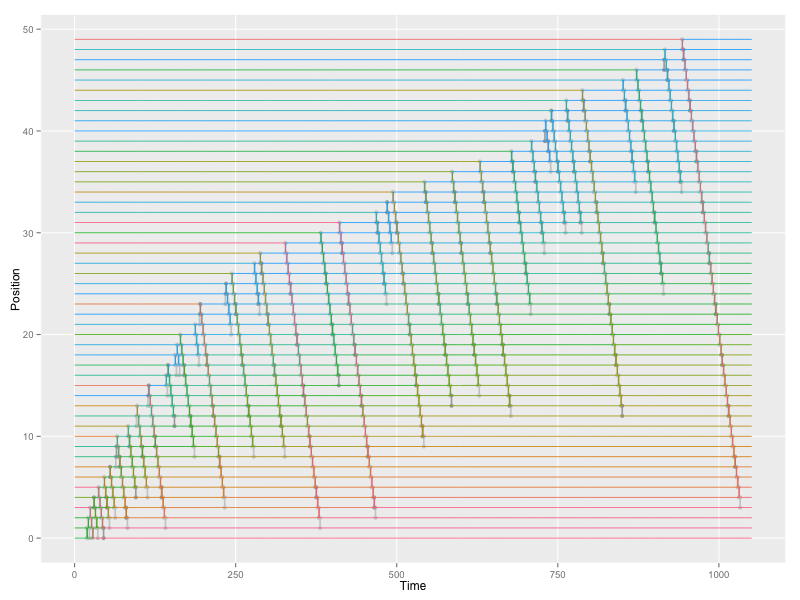
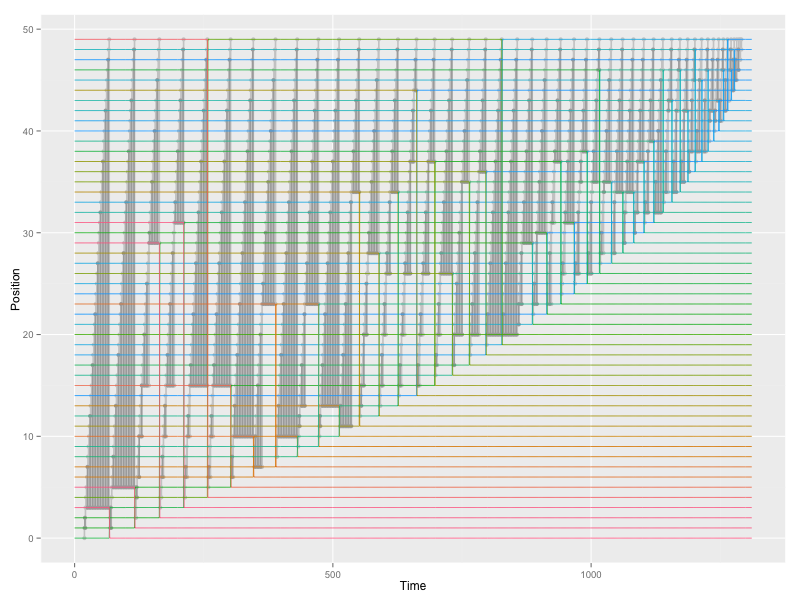
For the second part I wrote some methods in R which draw elements as different lines with the y-axis showing time (or iteration) and the x-axis showing each element’s position; their value defines their hue (red means small, blue means large). Naturally, swapping the position of two elements is shown as two very steep lines with different hues crossing each other; one goes up and the other goes down. On top of that (technically speaking, on the lower layer) there are also grey vertical lines that show comparisons; some comparisons do not result in swapping.
For now I have only uploaded the figures for sorting a shuffled list by three algorithms. I intend to add other algorithms too.


