In case you have been using HBO NOW recently and hated its user interface, you are not alone. It has some very basic flaws which make one wonder if anybody has spent anytime testing it. Continue reading
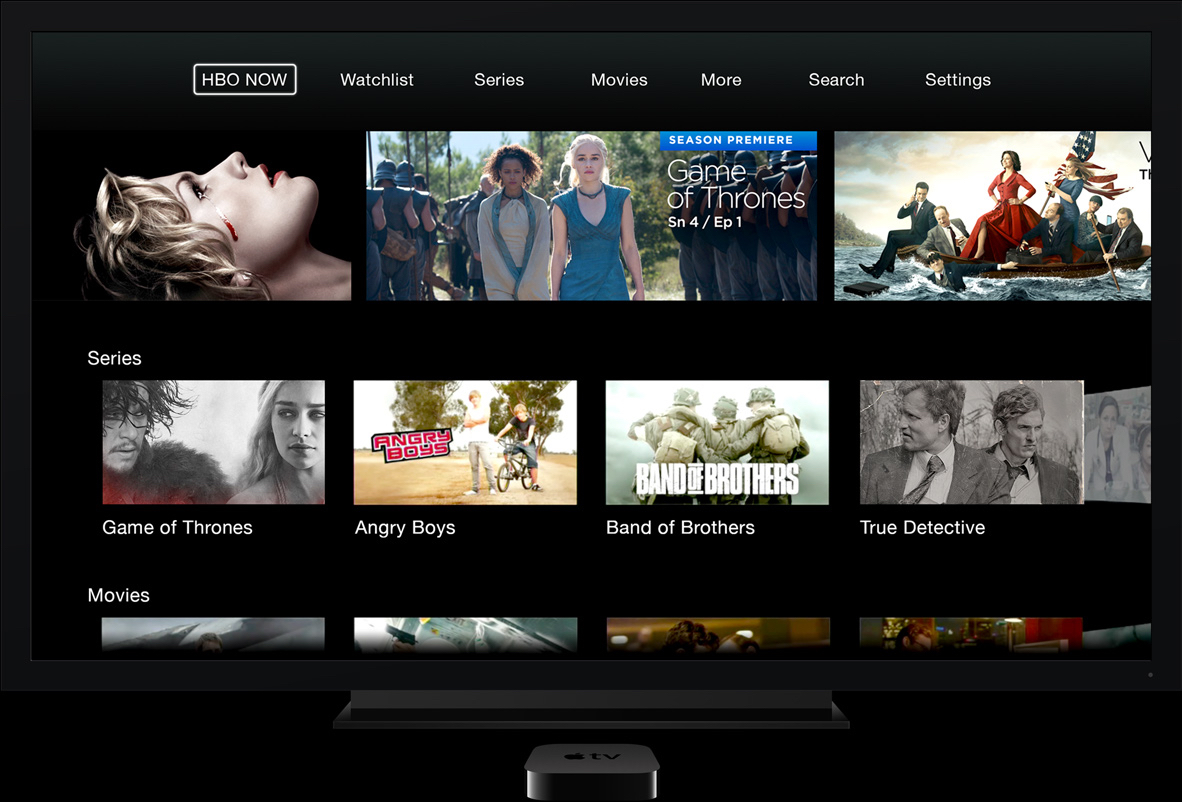
In case you have been using HBO NOW recently and hated its user interface, you are not alone. It has some very basic flaws which make one wonder if anybody has spent anytime testing it. Continue reading
Over the years I have reviewed many journal and conference papers and have graded several course projects. One of the most common mistakes I have encountered with –across many disciplines– is tools being used in the wrong place. Unfortunately, using the wrong tool is not like using 3.45 instead of pi (3.14) for calculating the circumference of a circle and having a large but consistent error; it is like confusing circumference of a circle with the volume of a sphere.
It seems to me that these mistakes are becoming more and more frequent which is alarming. Here I present three examples that I keep seeing.
A/B testing
One of the most commonly used tools in business intelligence, user experience research, medical research, and many other areas is A/B testing; A “statistical hypothesis testing” where two (or more) variants, groups (treatment and control), versions (A and B), or conditions are compared with each other. This test is suitable to answer questions such as:
– Which interaction technique takes less of user’s time?
– Does a drug affect a user’s behaviour?
– Are men more likely to take risks or women?
A/B testing is a great tool because it is flexible enough to be used in different fields and very straightforward. However, it does not fit many situations.
For starters, it is a relative measurement tool. You cannot use it to prove something is good or bad. You can only use it to show that something is better or worse than something else. Secondly, it needs at least two variations or groups for comparison.
In many occasions I have seen people try too hard to use A/B testing where in the wrong place. For example, they design an interface (let’s call it interface A) and want to show that it is a great interface, so they compare it with another interface (interface B); at this point they have only proven that A is better than B. Without any measurement about the quality of interface B this gives us no useful information. In some rare cases interface B is a known interface such as Microsoft Word; which still does not mean they can ignore the grading of interface B. In many cases though, interface B is as new and unknown as interface A. They can both be garbage and one being better than the other does not make it great. When I see cases like this the first thing that comes to my mind is that whoever has designed such an experiment probably started with one idea (even a great idea) but has come up with a worse idea just for the sake of having a race between the two. Similar to a person who plays chess with himself; you can never be sure if they put enough effort to play both sides, and even if he did, if a win indicates the player’s experience.
Likert scale
Another very commonly used tool is Likert scale where the responses to a questionnaire are in the form of multiple choices between two extremes (1. strongly agree, 2. agree, 3. neither agree nor disagree, 4. disagree, 5. strongly disagree). A Likert scale is ordinal, a good Likert scale is also balanced between the negative and positive responses. However, a Likert scale, by itself, is not a continuous, let alone linear, measurement. As a result, one cannot take the average of Likert scale results. In other words, if two respondents agreed with a statement –chose “2. agree”– and one person strongly disagreed with it –chose “5. strongly disagree”– , we cannot conclude that on average people neither agree nor disagree based on a simple math that the mean of two 2s and one 5, (2+2+5)/3, is 3. Mr. Achilleas Kostoulas explains it in more details in his blog. Many others point out the limitations of Likert scale, in most cases (9 out of 10) I see people treating Likert scale not only as a continuous but also a linear measurement tool; they even run statistical analysis methods unfit for such data too. In some cases Likert scales are used as an indirect subjective method of comparing two or more things. A simple example would like this:
One a scale of 1 to 5 (1. strongly agree, 2. agree, 3. neither agree nor disagree, 4. disagree, 5. strongly disagree) please answer the following questions:
Q1. I like Apples.
Q2. I like Oranges.
You can replace Apples and Oranges with Interface A and B.
Here the researcher is trying to create two scores for Apples and Oranges to compare them where he can just simply ask which one do you like more, Apples or Oranges? I know that it sounds like I am stating the obvious but seeing too many similar mistakes from “experts” convinces me that it is not so obvious to some people.
ANOVA
Analysis of Variance is a set of tools for comparing the means of two groups. Its main strength, in my opinion, is that it is relatively easier to learn/teach than other statistical methods of comparison, period. To be able to use ANOVA, three assumptions need to be met:
1. Independence of observations – this is an assumption of the model that simplifies the statistical analysis.
2. Normality – the distributions of the residuals are normal.
3. Equality (or “homogeneity”) of variances, called homoscedasticity — the variance of data in groups should be the same.
In most cases, the researchers do not even bother to check the first and third assumptions. However, most researchers use a histogram to show the distribution of the data; unfortunately, in many of those cases the histogram shows a non-normal distribution. To be a normal distribution, at the very least, the data should be continuous; but I have even seen ANOVA being used on binomial data (a special case of discrete probability distribution).
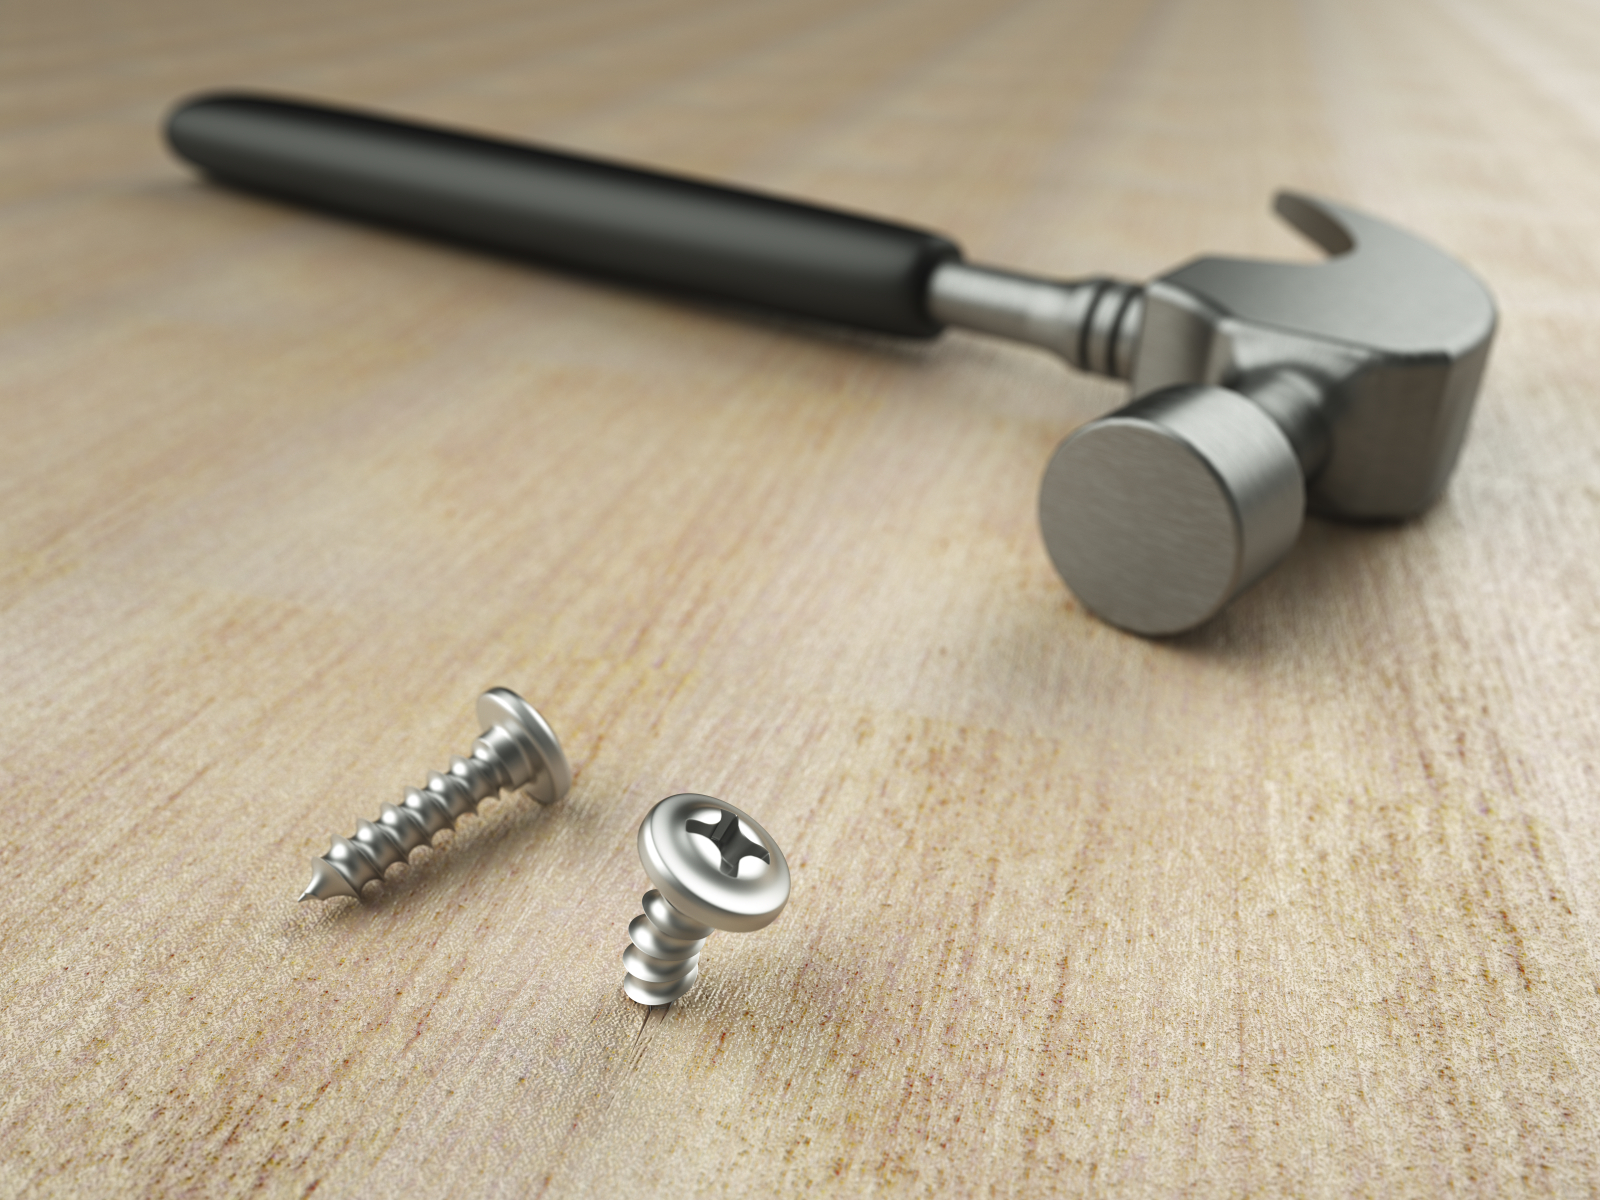
Mistakes like these cannot be ignored because a paper or a report is well-written or an experiment is hard to conduct. When the methodology is wrong, the results are useless; when the results are useless, the discussions and the conclusions based on them cannot be trusted. It is worse than hammering a screw to a wall. It is like using motor oil for cooking. Regardless of the quality of the beef, I am not going to risk my life eating that steak.
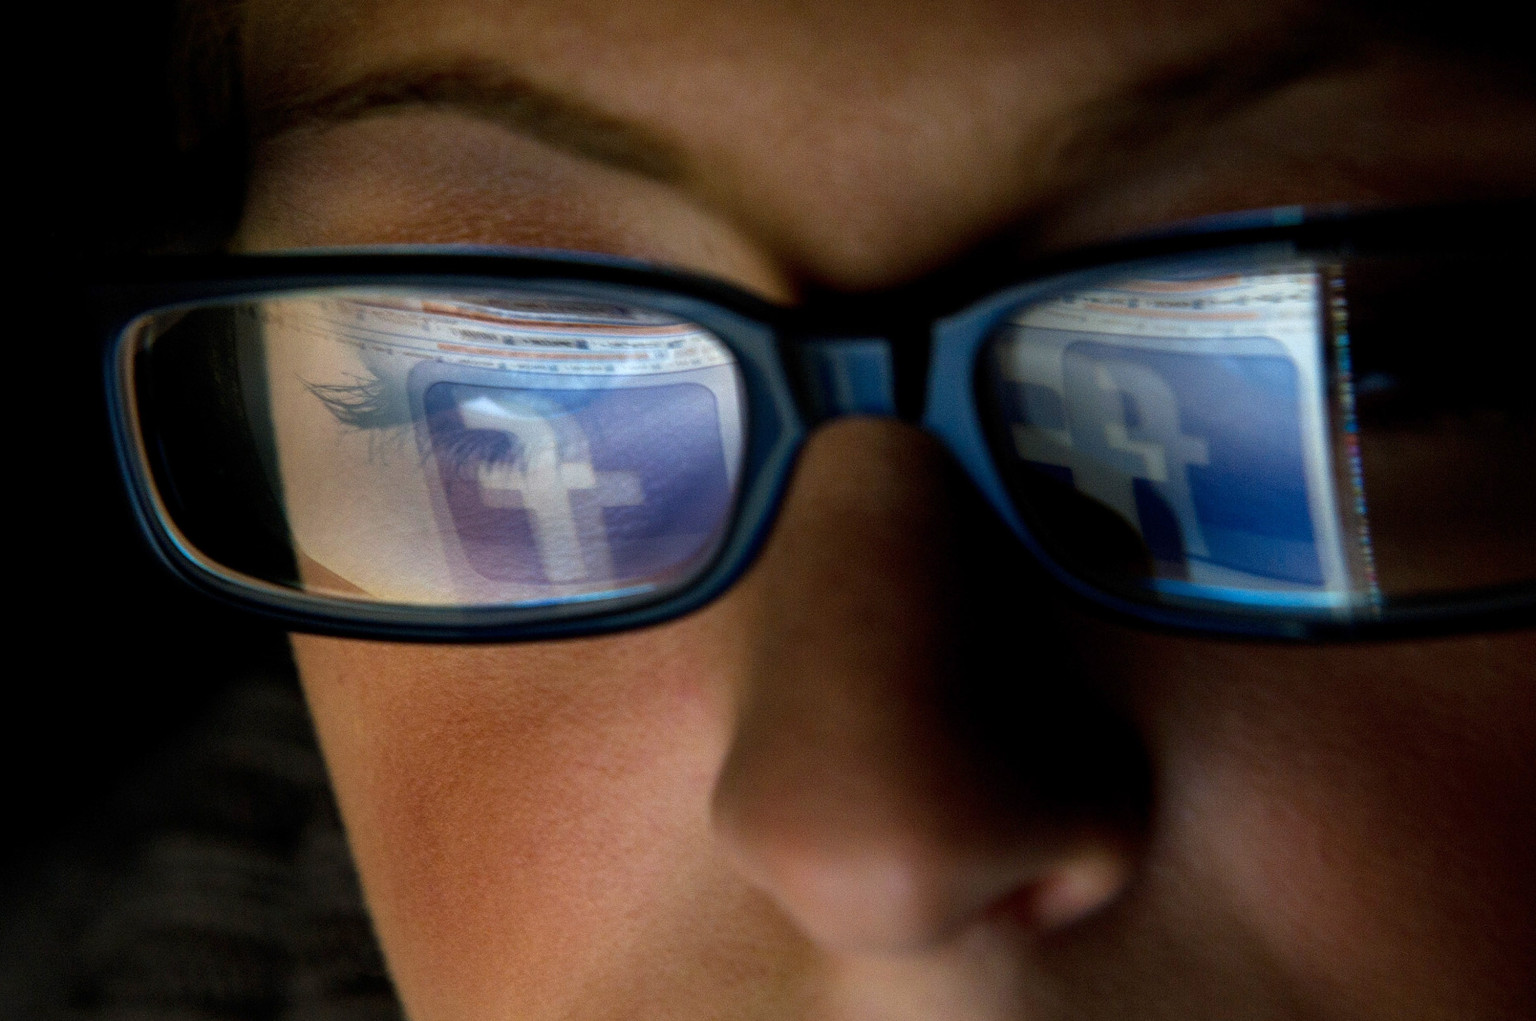
You may have noticed that you cannot share some posts by your friends on Facebook; you can like them, you can comment on them, but the share button does not exist.
Julia Homewood explains the rationale behind it: “The idea of the “Custom” setting is so you can hide what you’re posting from certain people, which is what you want and are doing. Because of that, facebook won’t allow your friends on that custom list to share it with others because you have asked it not to by setting that post so that only certain people can see it. Therefore if facebook allowed your friends to share it, they would be violating their privacy settings and not doing as you’e asked. Basically, if you set a post to custom because you don’t want a certain person to see it, and then facebook allows that post to be shared, it could then be shared by one of your friends with the very person you didn’t want to see the post in the first place. do you follow me? It’s a bit confusing, I know.”
At first glance, this may make sense; especially for personal stuff, your photos and videos, places you have been, or your favourite books and movies. However, it does not reflect the reality for the other not-so-personal stuff, news articles, political pieces, and anything available to the public. Besides, the visibility of personal stuff, is already governed by privacy settings; hiding the share button should not have any real effect.
Imagine a person who shares an article by Amnesty International about human rights violations of his native country. He wants his trusted circle of friends to read the article, and probably share it; he may fear getting persecuted for criticizing his government. He cannot and does not want to hide the article itself; he just does not want everyone to know that “he” posted the article on Facebook.
I hope Facebook realizes that the ability to Share and the Visibility of a post are very different concepts and should be treated differently to ensure privacy without compromising usability.

“Without any antecedent knowledge, without any warning whatever that such existed, he found himself an explorer in a totally new world. Now that the terrible unknown had let go of him, he forgot that the unknown had any terrors. He was aware only of curiosity in all the things about him.”
I was listening to the White Fang audio book on Audible. It is the first audio book I have bought on Audible (a subsidiary of Amazon). I wanted to check the last paragraph. I remembered that I had the eBook on Kindle as well, so I opened it anticipating that I would have to search for the paragraph. The Kindle app asked: “Your most recent page read is 64. Go to page 64?”. I chose “yes” not knowing where 64 actually was. Then I landed on the exact spot I was listening to on Audible. Could it be a coincidence? I remember reading up to about the same spot on Kindle before trying Audible but it was very unlikely that my last read page was exactly where I was on the audio book. So I experimented with them. Flipped a page back or fourth and switched to Audible and Audible asked the same question and landed where I was in the Kindle app.
This is great ubiquitous computing and great user interaction design. Nobody tried too hard to convince me to use Audible and Kindle together. No advertisement interrupted my YouTube video or a TV show to introduce this great feature to me. I just stumbled upon it by using both apps. I congratulate the people behind Kindle and Audible for such brilliant feature.
Sorting is at the top of the list for algorithm design and evaluation. I recently started refreshing my memory on algorithm design. I realized (again) that I am more interested in them than just the Big O notion. Continue reading

It is said that a headshot of a beautiful woman is the best way to persuade people (men and women) to click on an ad. However, a new trend is emerging: the picture of a Macbook, preferably a 13-inch Macbook Air, on a cozy desk Continue reading
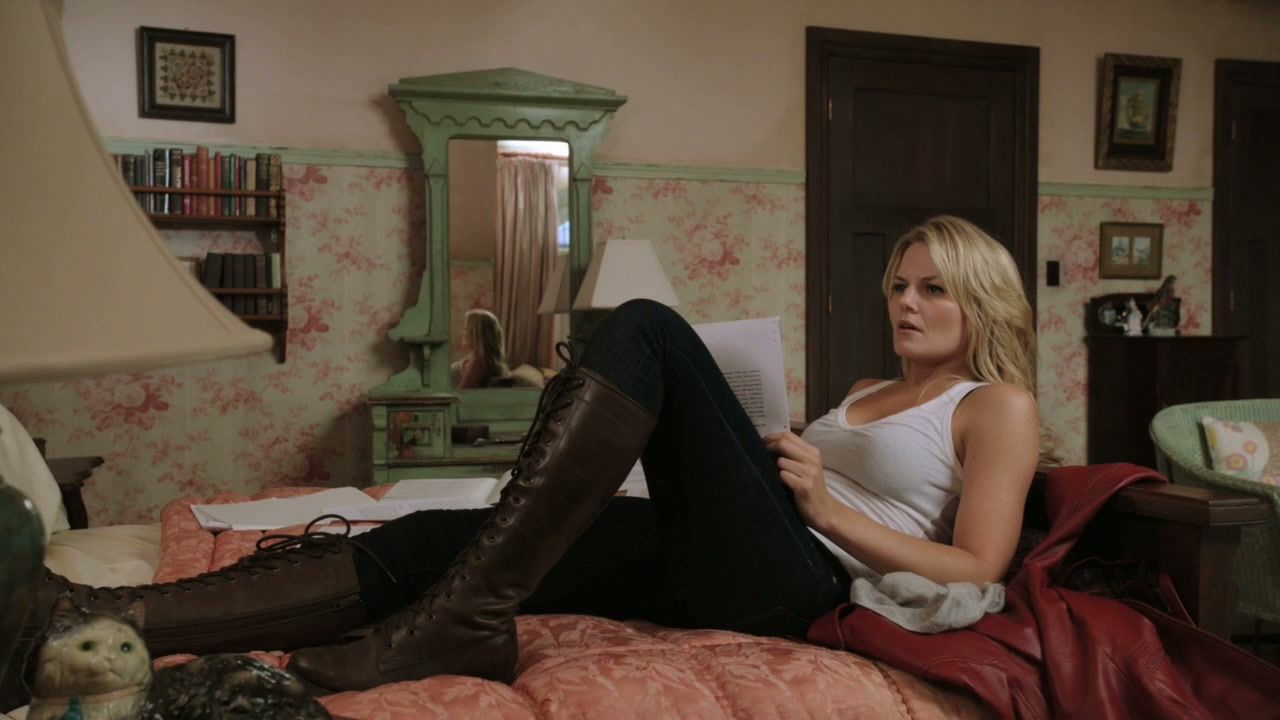
What is it with characters in TV series and movies lying on their bed (or even going to sleep) with their shoes on? They even sometimes cover themselves with the bed sheet without taking their shoes off! Continue reading
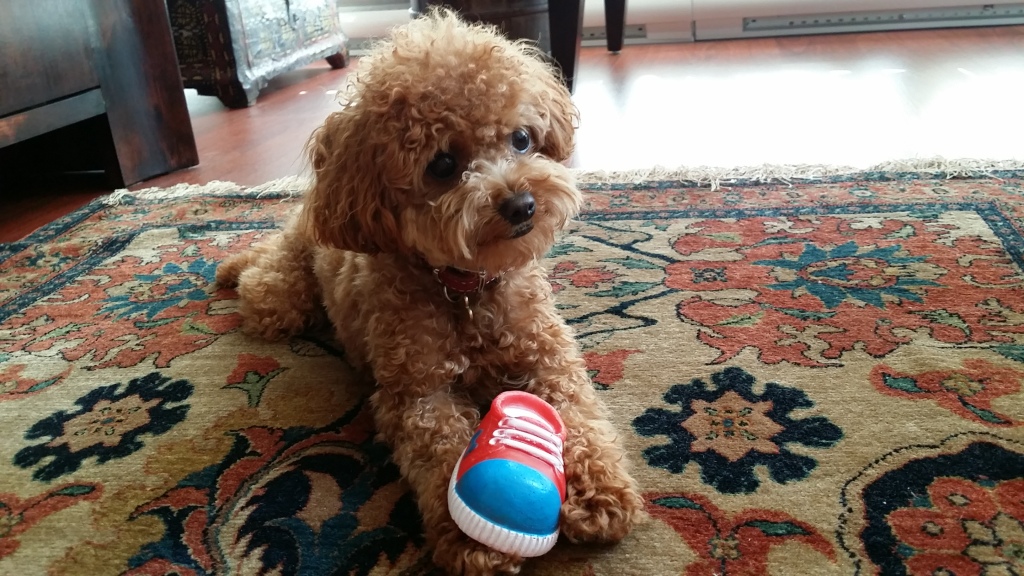
People who know me may remember that I always liked large short-haired or straight-haired dogs like the Doberman Pinscher and the Golden Retriever; but suddenly I got a very small curly-haired red toy poodle Continue reading